Dashboard for Tracking Software Usage
Dashboard for Tracking
Software Usage
Ontario Public Service
I led early phase of design of a dashboard for tracking software usage (Power Platform) of over 60,000 Ontario government staff. I collaborated with managers and data analysts to uncover workflow gaps and technical constraints. Translated insights into actionable features, producing high-fidelity prototypes and a component library to support scalable handoff.
I led early phase of design of a dashboard for tracking software usage (Power Platform) of over 60,000 Ontario government staff. I collaborated with managers and data analysts to uncover workflow gaps and technical constraints. Translated insights into actionable features, producing high-fidelity prototypes and a component library to support scalable handoff.
Read Full Case Study
Read Full Case Study
Research
Workshops
Interviews
Card Sorting
Design
Prototyping
Information Architecture
UI and Components
Tiimeline
2 Months
Internship
Tools
Figma
Product / Industry
B2B
Government
Web Application
Internal Tool
Team
Individual


Led the design of an enterprise dashboard for tracking Power Platform KPIs by conducting research with users and domain experts to define requirements and translated them into a prototype with key screens.
Led the design of an enterprise dashboard for tracking Power Platform KPIs by conducting research with users and domain experts to define requirements and translated them into a prototype with key screens.
Overview
During my internship at the Ontario Public Service I led an initiative to improve an internal dashboard tool that helps Ontario Government managers track Power Platform usage and licensing across teams. Over four months, I gathered requirements through stakeholder interviews, identified KPI needs, and delivered a high-fidelity prototype and component library as a proof of concept.
During my internship at the Ontario Public Service I led an initiative to improve an internal dashboard tool that helps Ontario Government managers track Power Platform usage and licensing across teams. Over four months, I gathered requirements through stakeholder interviews, identified KPI needs, and delivered a high-fidelity prototype and component library as a proof of concept.
Identifying how Managers Track Software Usage
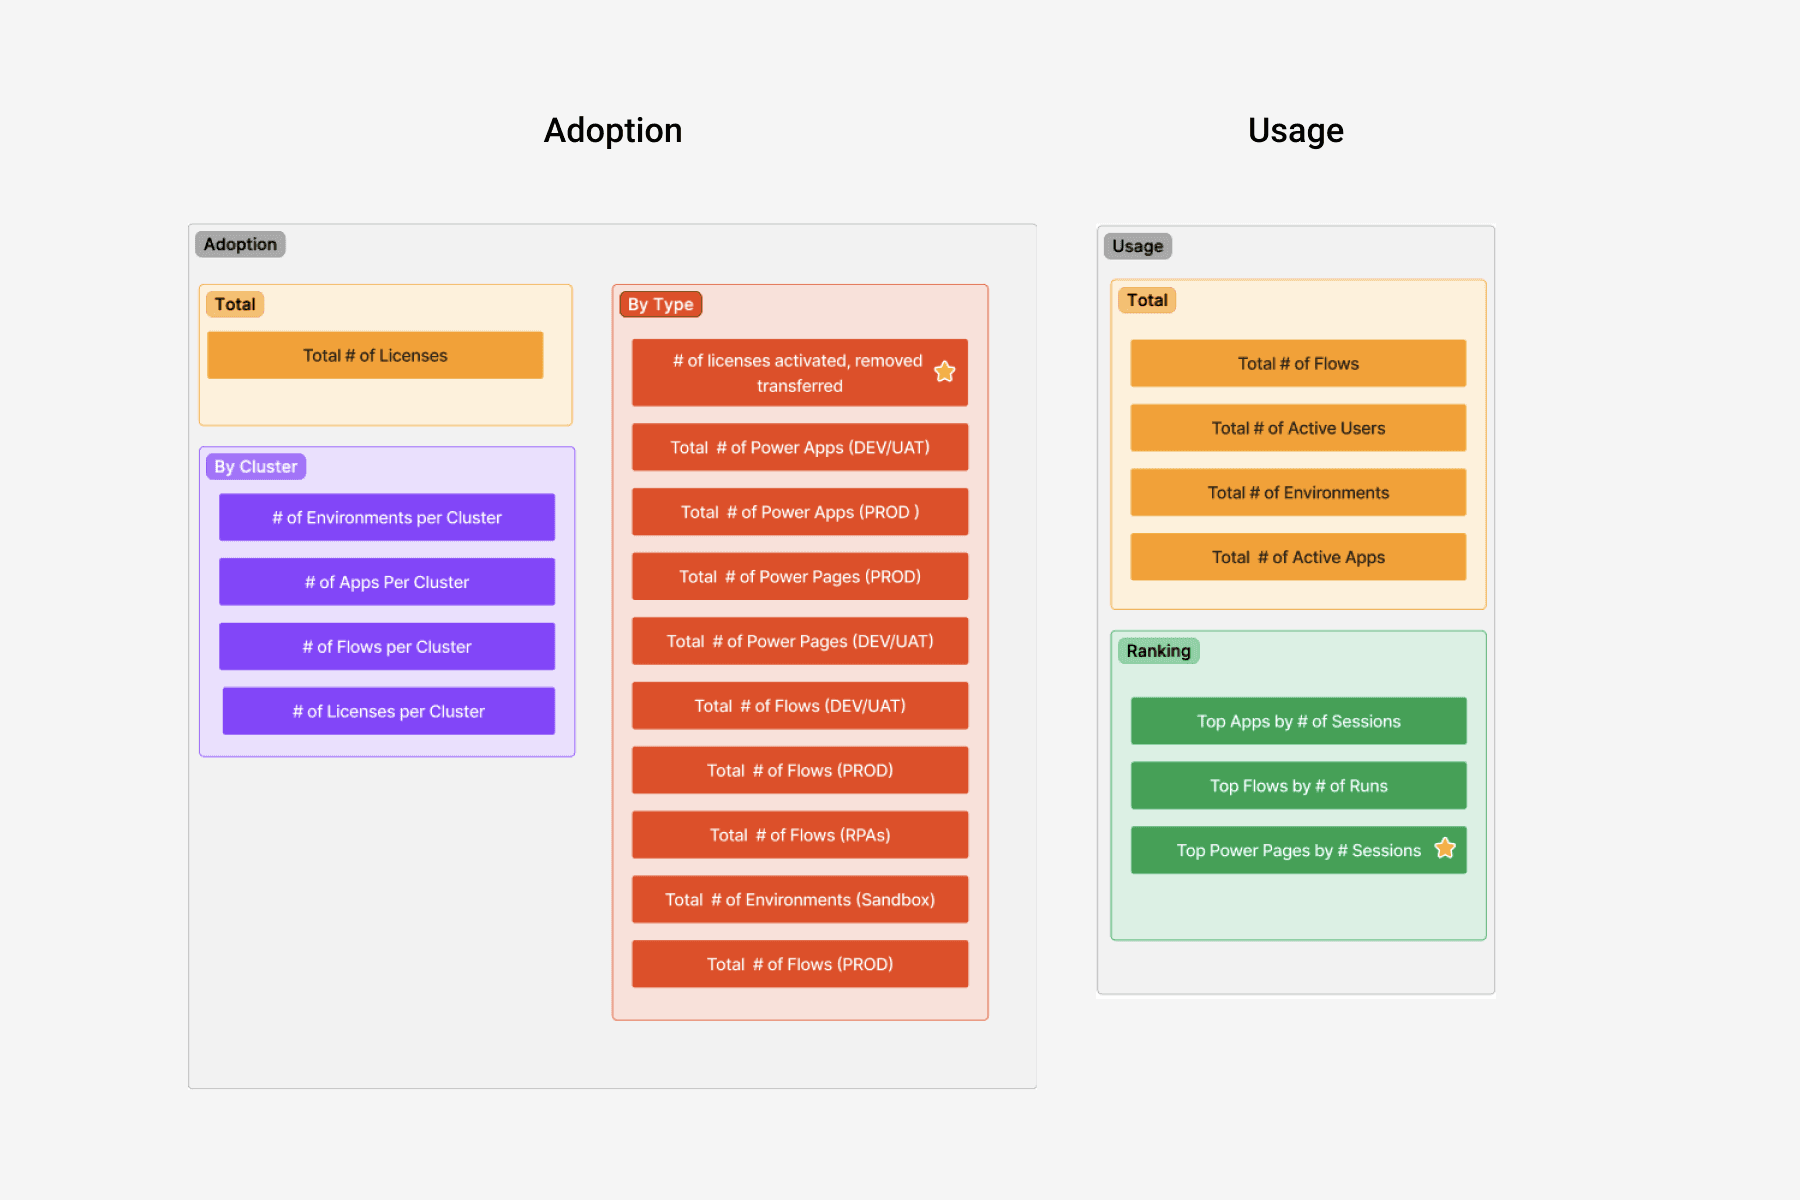
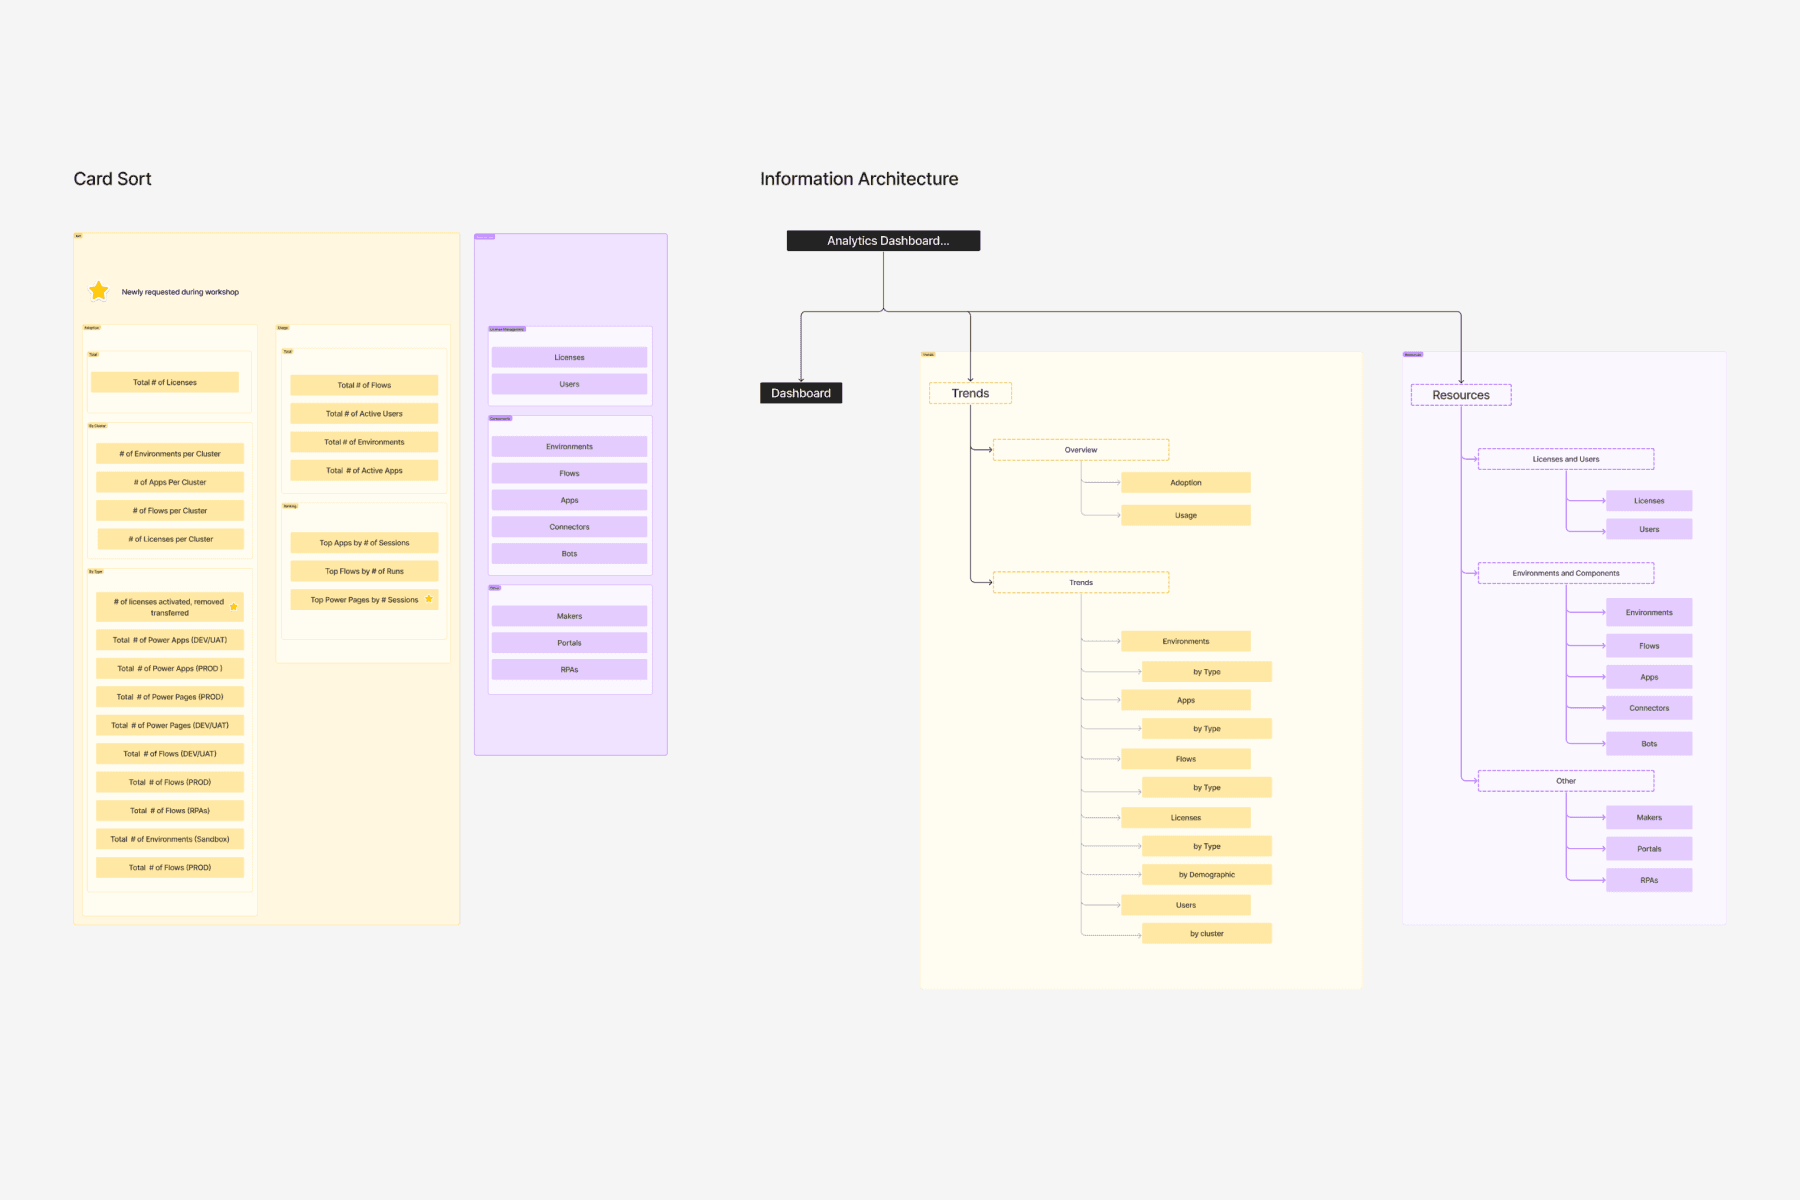
There was no single source of information for what metrics and resources we wanted to track and how they can be organized. Through workshops and interviews with managers and data analysts I was able to solve this issue and organize the metrics through card sorting sessions.
There was no single source of information for what metrics and resources we wanted to track and how they can be organized. Through workshops and interviews with managers and data analysts I was able to solve this issue and organize the metrics through card sorting sessions.
Research Driven Information Architecture
Because of the previous research on data organization, I was able to translate my findings into an information architecture, which after being refined - through tree-testing, adjusting on number of levels and navigation patterns - ensured an organized and efficient set of screens.
Because of the previous research on data organization, I was able to translate my findings into an information architecture, which after being refined - through tree-testing, adjusting on number of levels and navigation patterns - ensured an organized and efficient set of screens.
Defining Components and Design Patterns
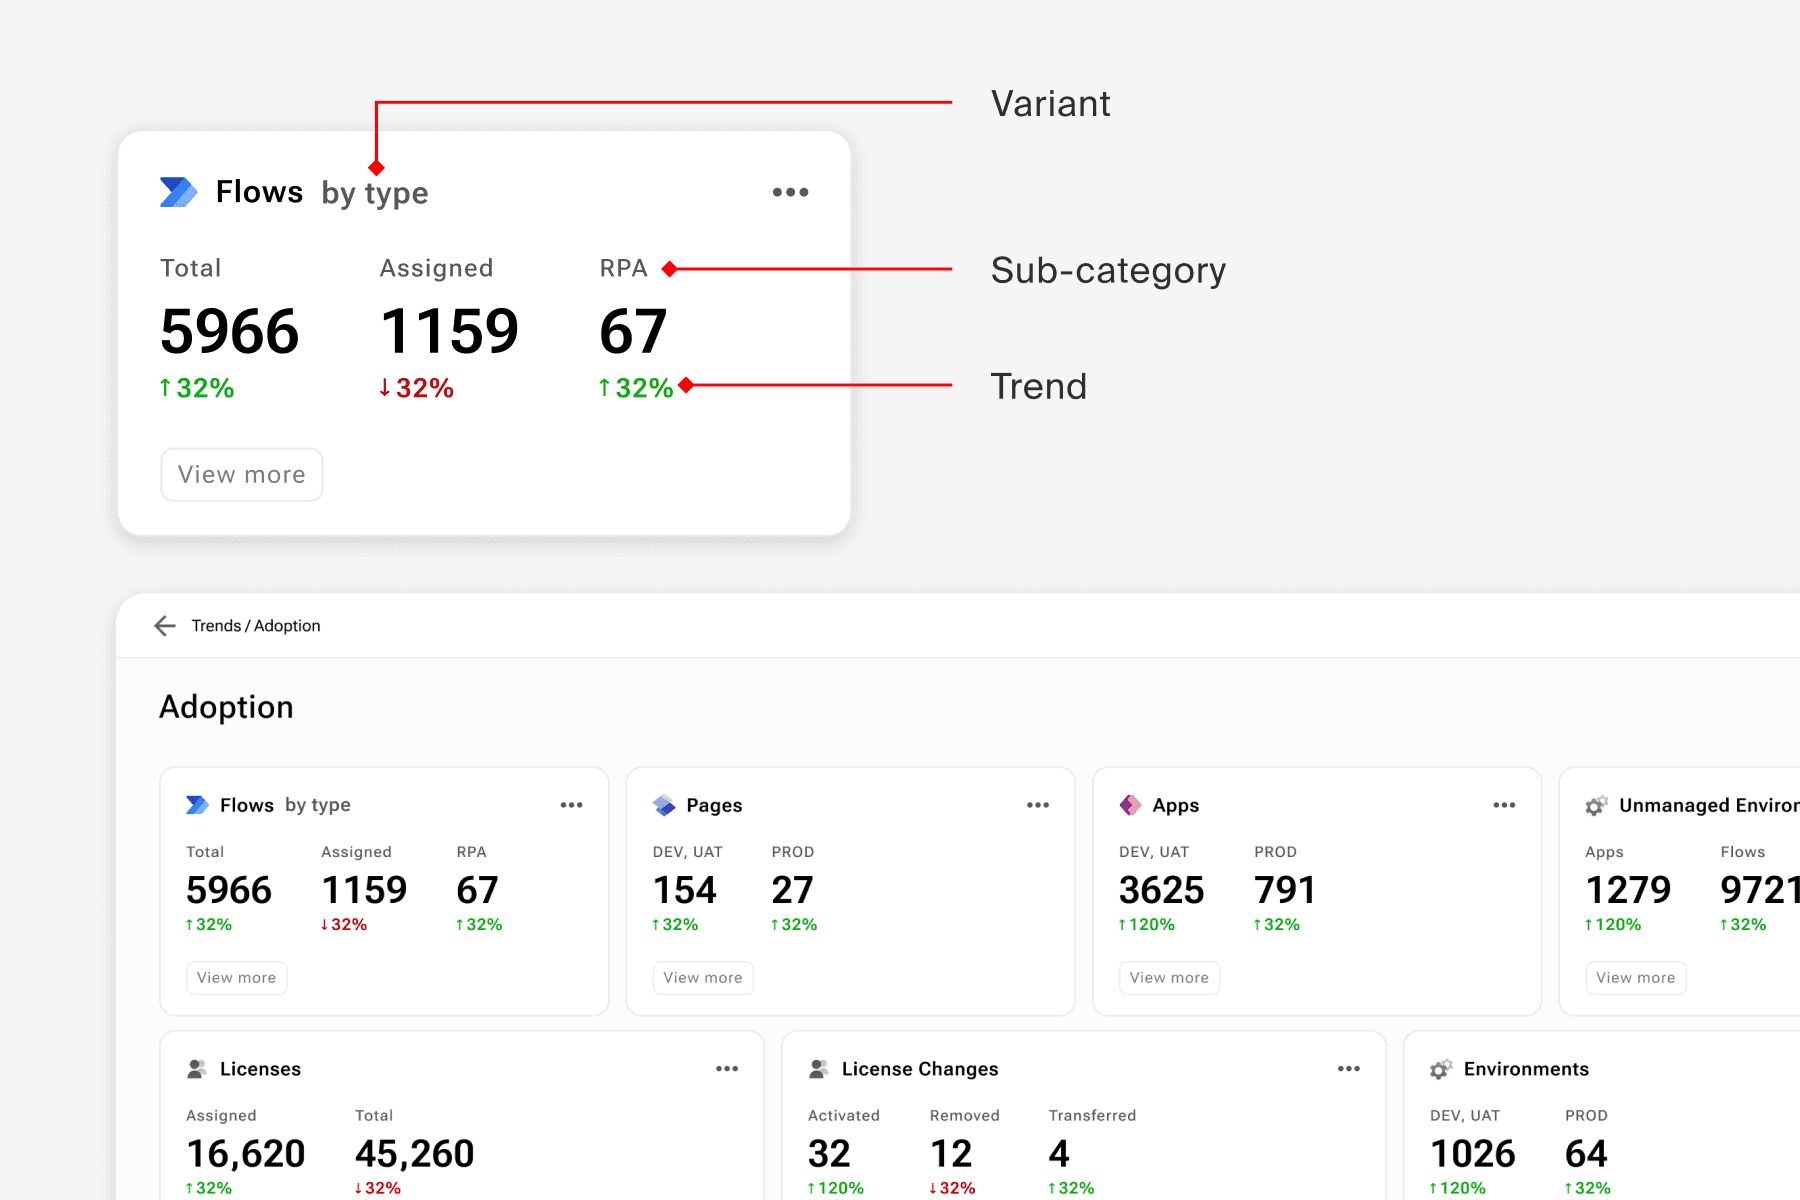
After defining the key screens, I designed modular components and refined navigation and labelling, resulting in a high-fidelity prototype that, while conceptual at this early stage of the project, clearly conveyed design intent for future designers and developers to build on.
After defining the key screens, I designed modular components and refined navigation and labelling, resulting in a high-fidelity prototype that, while conceptual at this early stage of the project, clearly conveyed design intent for future designers and developers to build on.

AI Features
Research showed that it was common to receive a list of user emails and asked to check for their license statuses. For similar use cases I conceptualized user flows that use AI to process searches using "messy" text formats such as a long list of email addresses, and file attachments such as spreadsheets.
Research showed that it was common to receive a list of user emails and asked to check for their license statuses. For similar use cases I conceptualized user flows that use AI to process searches using "messy" text formats such as a long list of email addresses, and file attachments such as spreadsheets.